
Performing aspect analysis
Compute aspect, show it as a continuous colour wheel or eight direction classes, read the distribution of directions and export the result.
You will learn
- Compute and display aspect.
- Read the share of each direction.
- Export the aspect raster.
Prerequisites
Data for this tutorial
Nanda Devi massif, SRTM (real terrain) Download nanda-devi-srtm-1arcsec.tif
- Format
- GeoTIFF, 1 band, Int16, Deflate, tiled
- CRS
- EPSG:4326 (WGS 84, longitude/latitude)
- Content
- Elevations 2285 to 7801 m above the EGM96 geoid; lon 79.7276 to 79.9776, lat 30.2279 to 30.4779
- In Orbis3D
- Data panel ▸ Sample data ▸ Nanda Devi massif, SRTM (real terrain) ▸ Load
- Licence
- SRTM 1 arc-second, NASA/USGS, public domain
Synthetic samples are CC0 1.0; the SRTM sample is public domain. About the datasets
The task
You want to know which way the slopes of the Nanda Devi massif face, for example to find north-facing slopes that keep snow longer.
Steps
- Load Nanda Devi massif.
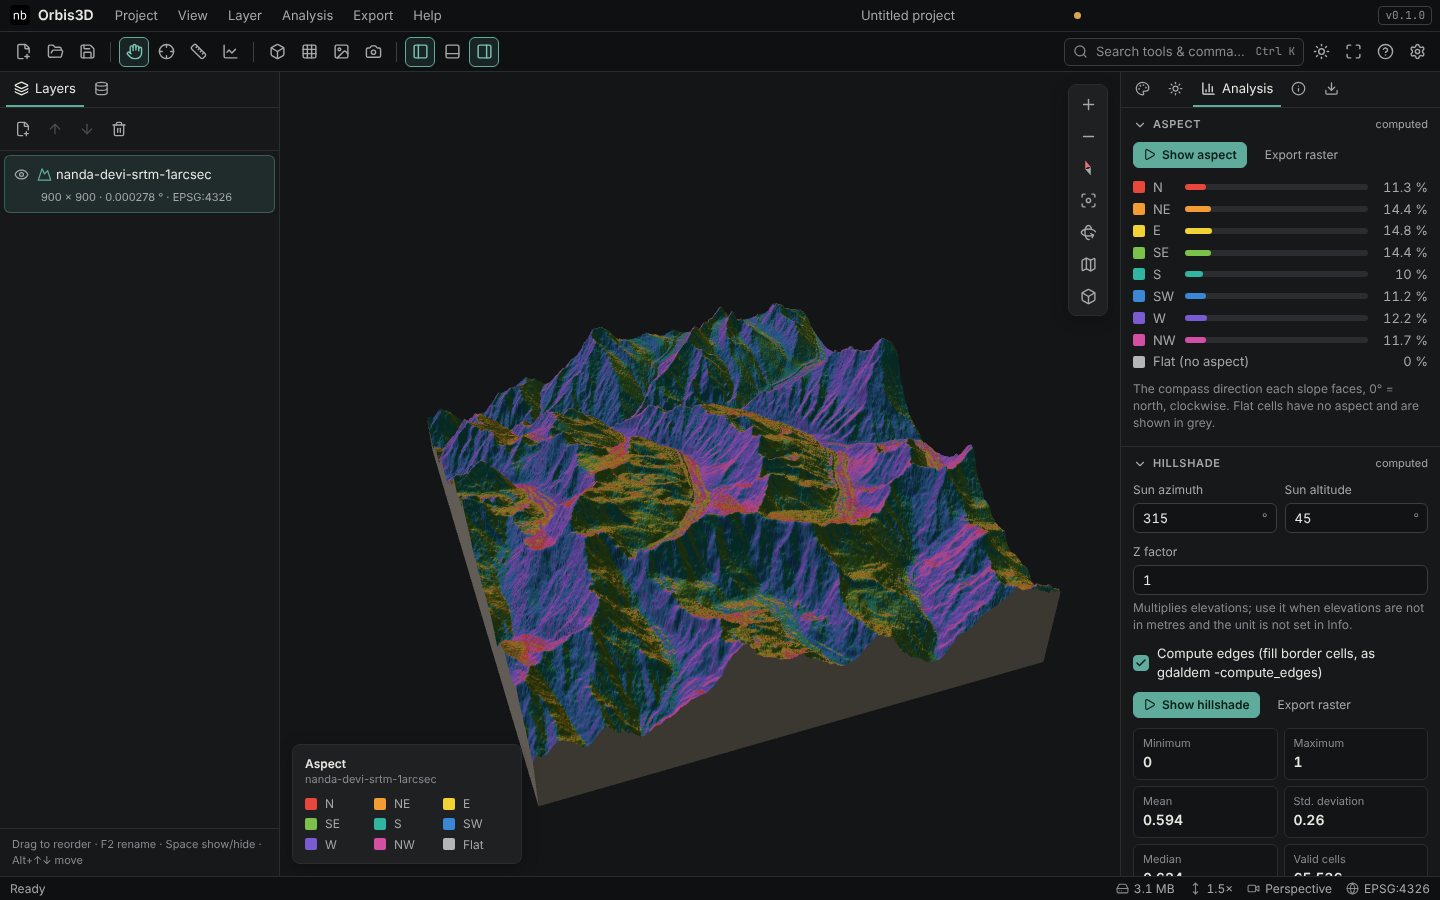
- Open Analysis ▸ Aspect and click Compute aspect. The terrain is coloured with a continuous aspect wheel: red for north, through yellow (east), teal (south) and violet (west) back to red.
- In the Surface tab, tick Eight direction classes (N, NE, …) to colour by the eight 45° classes instead. The legend lists the classes and Flat.
- Back in the Analysis tab, read the bars under Aspect: the percentage of cells facing each direction.
- Click Export raster to save aspect in degrees (0–360, NoData -9999) as GeoTIFF or ASCII Grid. Flat cells are stored as -1.
Expected result
For Nanda Devi the directions are spread fairly evenly, as in most deeply dissected mountains:
| N | NE | E | SE | S | SW | W | NW |
|---|---|---|---|---|---|---|---|
| 11.3 % | 14.4 % | 14.8 % | 14.4 % | 10.0 % | 11.2 % | 12.2 % | 11.7 % |
No cell is exactly flat. The sample valley, by contrast, is dominated by south-west and west-facing slopes (23.9 % and 18.5 %), because its main ridge faces the valley from the east.
## Common mistakes- Averaging aspect. The mean in the statistics is of degrees and has little meaning for a circular quantity. Use the class distribution.
- Over-reading flat areas. On valley floors and plateaus, tiny elevation noise decides the direction. Check the slope there.