
Understanding terrain statistics
Read elevation statistics and the histogram, know whether they come from the working grid or every cell, compute exact statistics and export them.
You will learn
- Read minimum, maximum, mean, median, standard deviation and counts.
- Interpret the histogram.
- Compute exact statistics from every full-resolution cell.
Prerequisites
Data for this tutorial
Nanda Devi massif, SRTM (real terrain) Download nanda-devi-srtm-1arcsec.tif
- Format
- GeoTIFF, 1 band, Int16, Deflate, tiled
- CRS
- EPSG:4326 (WGS 84, longitude/latitude)
- Content
- Elevations 2285 to 7801 m above the EGM96 geoid; lon 79.7276 to 79.9776, lat 30.2279 to 30.4779
- In Orbis3D
- Data panel ▸ Sample data ▸ Nanda Devi massif, SRTM (real terrain) ▸ Load
- Licence
- SRTM 1 arc-second, NASA/USGS, public domain
Synthetic samples are CC0 1.0; the SRTM sample is public domain. About the datasets
The task
You need the basic numbers of a DEM for a report: its elevation range, average, spread and how many cells hold data.
Steps
- Load Nanda Devi massif and open Info ▸ Statistics.
- Read the tiles: Minimum, Maximum, Mean, Std. deviation, Median, Valid cells, NoData cells and Relief (maximum − minimum).
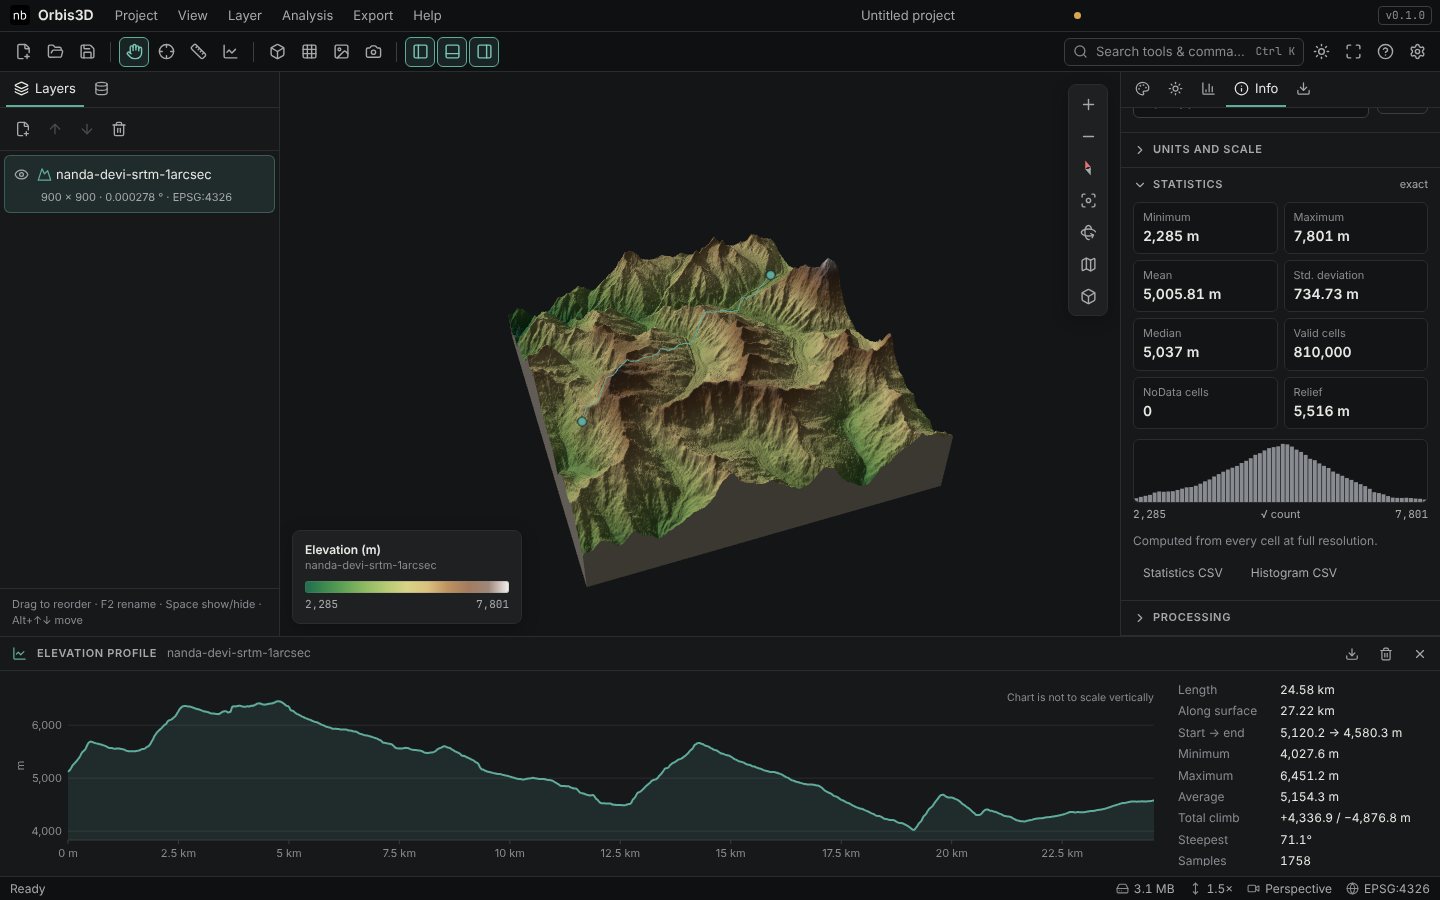
- Read the histogram: 64 bars from the minimum to the maximum elevation. Bar heights use a square-root scale so that small classes stay visible. Nanda Devi's histogram is roughly bell-shaped around 5,000 m.
- Check the line under the histogram. It says whether the statistics come from every cell at full resolution or from the working grid (see below).
- Export with Statistics CSV (all values with units, plus slope, hillshade, aspect and difference results if computed) or Histogram CSV (the 64 classes with their cell counts).
Expected result
| Statistic | Nanda Devi |
|---|---|
| Minimum | 2,285 m |
| Maximum | 7,801 m |
| Mean | 5,005.81 m |
| Median | 5,037 m |
| Standard deviation | 734.73 m |
| Valid cells | 810,000 |
| NoData cells | 0 |
The same values are reported by gdalinfo -stats for this file.
Working grid or every cell
- For rasters within the processing budget (4 million cells by default), the working grid is the full raster and the statistics are exact.
- For larger rasters, the working grid is reduced by averaging blocks of cells, and the statistics describe that grid. Averaging slightly narrows the range: the true minimum and maximum may be beyond it.
- Click Compute exact statistics to read every full-resolution cell in blocks. Minimum, maximum, mean, standard deviation and counts are then exact; the median and the 2 % and 98 % percentiles are interpolated from a 4,096-class histogram (to within 1/4096 of the range). You can cancel it with the Cancel button in the progress message.
Definitions
- Mean and standard deviation are computed in double precision over valid cells only; the standard deviation is the population standard deviation, as in GDAL.
- Median: half of the cells are lower, half higher.
- NoData cells are never included.
Common mistakes
- Minimum of -9999. The NoData value is not declared. Set it in Info ▸ NoData.
- Comparing exact and working-grid numbers. Note which one you report; the line under the histogram says it.