
Creating contour lines
Generate contour lines at any interval, limit them to a range, style and label index contours, and export them as GeoJSON.
You will learn
- Generate contours with an interval and base.
- Style lines, index contours and labels.
- Export contours as GeoJSON for GIS software.
Prerequisites
Data for this tutorial
Sample valley DEM (synthetic) Download orbis3d-sample-valley.tif
- Format
- GeoTIFF, 1 band, Float32, Deflate, tiled
- CRS
- EPSG:32643 (WGS 84 / UTM zone 43N)
- Content
- Elevations 419.5 to 1452.5 m; NoData -9999 in the south-west corner
- In Orbis3D
- Data panel ▸ Sample data ▸ Sample valley DEM (synthetic) ▸ Load
- Licence
- Synthetic, CC0 1.0
Synthetic samples are CC0 1.0; the SRTM sample is public domain. About the datasets
The task
You want contour lines on the sample valley every 50 m, with labelled index lines every 250 m, and the lines as a GeoJSON file for a map.
Steps
- Load the sample valley and open Analysis ▸ Contour lines.
- Orbis3D proposes an interval that gives about 10 to 25 levels; for the valley that is 100 m. Set Interval to
50and keep Base at0. Levels are base + k × interval: 450, 500, 550 … m. The hint under the fields estimates the number of levels. - Optionally tick Limit to an elevation range and set From and To, for example 500 to 1,200 m.
- Choose a Colour and Index line every 5th line. Index lines (here every 250 m) are drawn solid; the others are slightly transparent. Keep Label index contours ticked to write their elevation on them.
- Click Generate contours. The lines are drawn on the terrain surface. Use Hide and Show to toggle them.
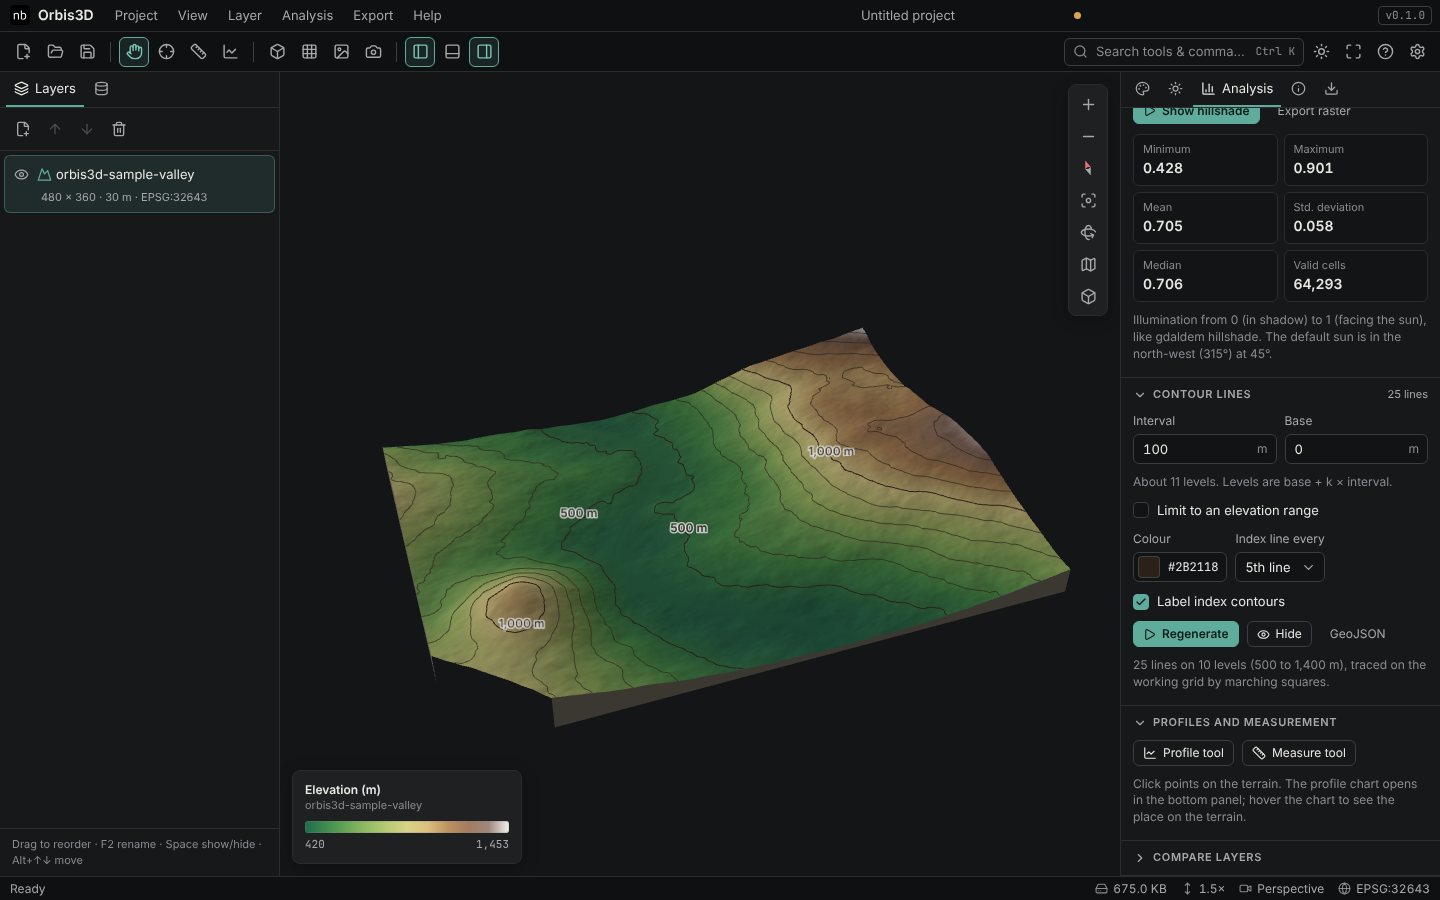
- Click GeoJSON (or Export ▸ Export contours as GeoJSON) to save the lines. Each line is a LineString with an
elevproperty.
Expected result
With a 50 m interval the valley has 53 lines on 21 levels, from 450 to 1,450 m. With the proposed 100 m interval it has 25 lines on 10 levels.
How contours are traced
Contours are traced with marching squares on the grid of cell centres, the same sampling as gdal_contour. Each square of four cells is crossed by a contour where its corners lie on both sides of the level, with the crossing interpolated linearly; ambiguous saddles are resolved with the average of the four corners. Line pieces are joined into continuous lines. Squares with a NoData corner are skipped, so lines stop at NoData (gdal_contour continues up to half a cell further).
GeoJSON coordinates
For geographic, UTM and Web Mercator DEMs the GeoJSON uses longitude and latitude (WGS 84), as the GeoJSON standard requires. For other coordinate systems the coordinates stay in the DEM's CRS and the file names that CRS; most GIS software reads both.
Common mistakes
- Too many lines. A small interval on rough terrain creates thousands of lines and slows the view. Orbis3D refuses intervals that would give more than 10,000 levels or 3 million segments.
- Lines look jagged. Contours follow the working grid. A smoother result needs a smoothed DEM, not a smaller interval.