
Performing slope analysis
Compute slope in degrees or percent, colour the terrain by slope, read the statistics and histogram, and export the slope raster.
You will learn
- Compute slope with your choice of units and z factor.
- Show slope on the terrain and read its legend and statistics.
- Export the slope raster as GeoTIFF or ASCII Grid.
Prerequisites
Data for this tutorial
Nanda Devi massif, SRTM (real terrain) Download nanda-devi-srtm-1arcsec.tif
- Format
- GeoTIFF, 1 band, Int16, Deflate, tiled
- CRS
- EPSG:4326 (WGS 84, longitude/latitude)
- Content
- Elevations 2285 to 7801 m above the EGM96 geoid; lon 79.7276 to 79.9776, lat 30.2279 to 30.4779
- In Orbis3D
- Data panel ▸ Sample data ▸ Nanda Devi massif, SRTM (real terrain) ▸ Load
- Licence
- SRTM 1 arc-second, NASA/USGS, public domain
Synthetic samples are CC0 1.0; the SRTM sample is public domain. About the datasets
The task
You want a slope map of the Nanda Devi massif to see where the ground is steepest, and the slope raster for use in other software.
Steps
- Load Nanda Devi massif (Data ▸ Sample data).
- Open Analysis ▸ Slope.
- Choose Units: Degrees or Percent rise.
- Keep Z factor at 1 (the elevations are metres) and Compute edges ticked.
- Click Compute slope. Orbis3D computes slope for every cell of the working grid, colours the terrain with the Slope (yellow–red) ramp from 0° to the steepest value, and shows the statistics and a histogram.
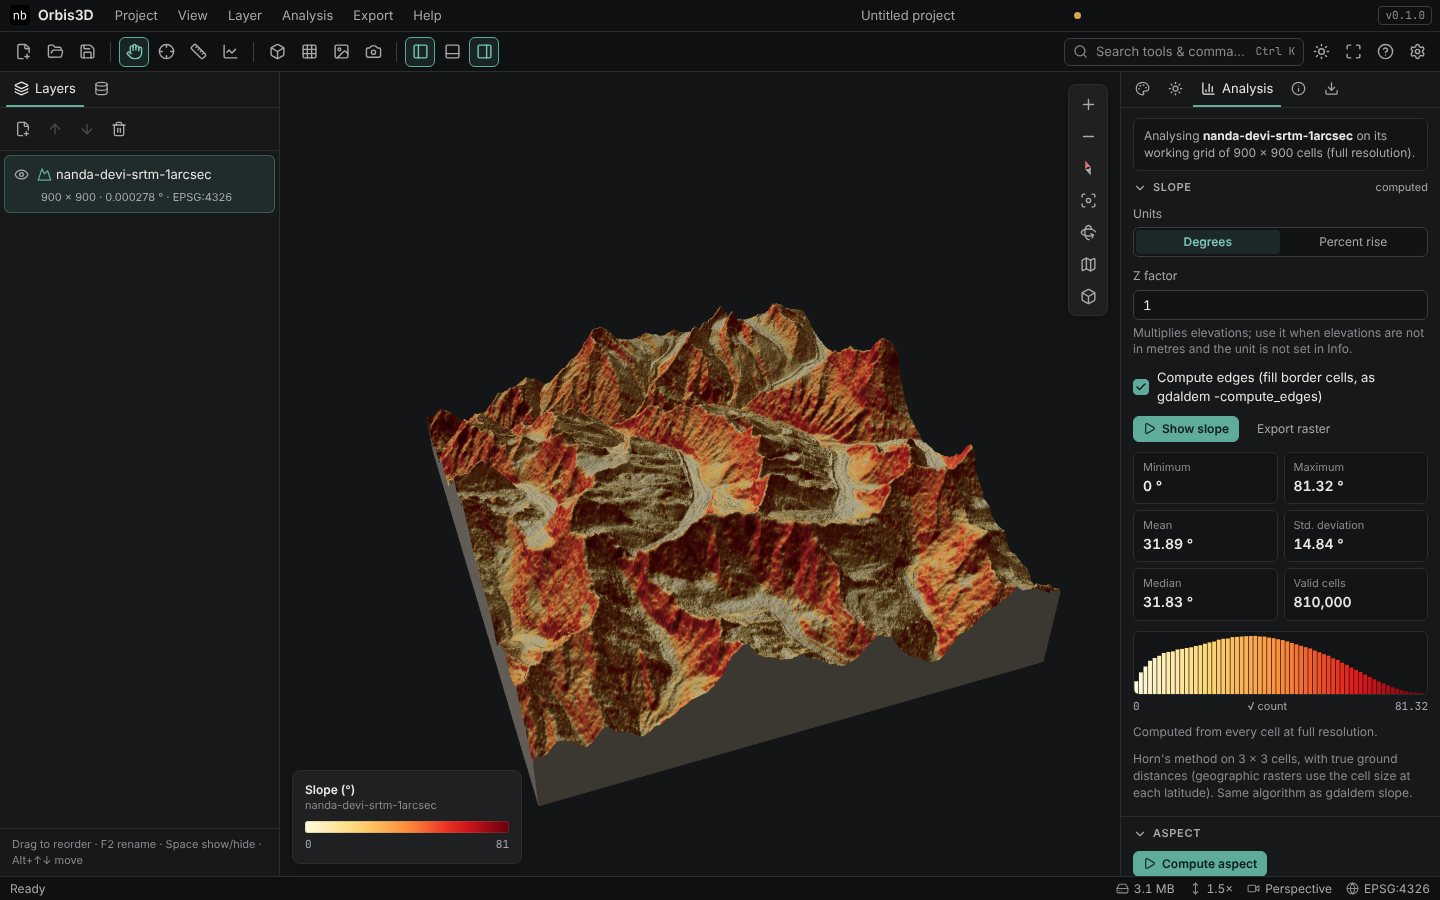
- Change the colours in the Surface tab like any other colouring: another ramp, a manual range (for example 0° to 60°), or classes such as
0, 15, 30, 45, 90with Custom intervals…. - To export, click Export raster (or Export ▸ Analysis results ▸ Slope). Choose GeoTIFF or ASCII Grid under Raster format in the Export tab first.
Expected result
| Statistic | Value |
|---|---|
| Minimum | 0.00° |
| Maximum | 81.32° |
| Mean | 31.89° |
| Median | 31.83° |
| Standard deviation | 14.84° |
The steepest cells line the summit ridges and the gorge walls; the glacier valley floors are gentle.
Notes
- Slope is computed on the working grid. The info box at the top of the Analysis tab says how large it is and whether it is reduced from the source. Nanda Devi (900 × 900 cells) is analysed at full resolution with the default settings.
- After you change the units, z factor or Compute edges, click Compute slope again; the slope colouring updates automatically.
- The exported GeoTIFF is Float32 with NoData -9999 and the layer's georeferencing.
Common mistakes
- Elevations in feet. Set the elevation unit in Info ▸ Units and scale (or a z factor of 0.3048) before computing slope.
- Expecting exaggerated slopes. Vertical exaggeration does not change slope values.
Troubleshooting
- The slope map is mostly one colour. A few extreme cells stretch the range. Choose 2 – 98 % under Value range in the Surface tab.